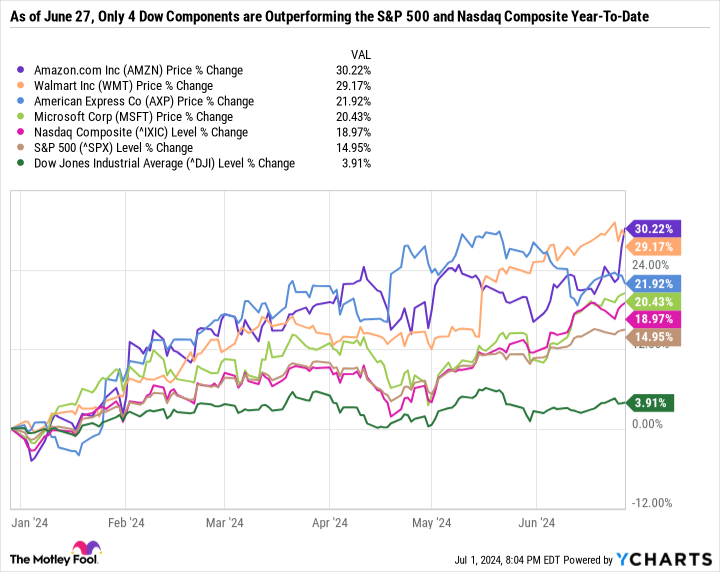
Amazon (NASDAQ: AMZN) joined the Dow Jones Industrial Average in late February — giving the traditionally stodgy, income-oriented index more exposure to growth.
Amazon has continued its torrid run since 2023. As of June 27, it is the best-performing stock in the index.
Here’s why Amazon continues to climb higher and whether the growth stock is worth buying around its all-time high.

Amazon is gushing cash
Before changing its name to Alphabet (NASDAQ: GOOGL) (NASDAQ: GOOG), Google was named after its flagship search engine. But YouTube is arguably Alphabet’s crown jewel. Facebook was named after its flagship social media app, but then changed its name to Meta Platforms (NASDAQ: META). Instagram is arguably more valuable than Facebook today. Similarly, Amazon is named after its only retail outlet, but Amazon Web Services (AWS) is where much of the value lies.
AWS is the undisputed leader in cloud infrastructure. According to HG Insights 2023 Infrastructure as a Service Market Report, AWS had a 50.1% market share among the top 10 cloud providers and the highest year-over-year customer count growth at 31%. AWS has been tapping into start-ups, with 86% of AWS customers spending less than $1,000 a month on AWS services — according to HG Insights.
The impact of AWS on the broader business is undeniable. Here’s a look at Amazon’s trailing-12-month (TTM) results as of the first quarter of 2024 compared to the same periods over the last five years.
|
Metric |
Q1 2020 TTM |
Q1 2021 TTM |
Q1 2022 TTM |
Q1 2023 TTM |
Q1 2024 TTM |
|---|---|---|---|---|---|
|
North America revenue |
$181.09 billion |
$254.52 billion |
$284.71 billion |
$323.52 billion |
$362.29 billion |
|
North America operating income |
$6.06 billion |
$10.79 billion |
$2.25 billion |
($381 million) |
$18.96 billion |
|
International revenue |
$77.64 billion |
$115.96 billion |
$125.9 billion |
$118.37 billion |
$134.01 billion |
|
International operating income |
($2 billion) |
$2.37 billion |
($3.46 billion) |
($7.71 billion) |
$903 million |
|
AWS revenue |
$37.55 billion |
$48.65 billion |
$67.14 billion |
$83 billion |
$94.44 billion |
|
AWS operating income |
$10.05 billion |
$14.62 billion |
$20.89 billion |
$21.45 billion |
$28.93 billion |
Data source: Amazon.
Notice the inconsistent operating income from Amazon’s North America and international segments, as well as the somewhat sluggish top-line growth. Meanwhile, AWS has been a juggernaut, with TTM operating income increasing nearly threefold in just five years.
The most impressive metric in this table is that AWS operating income has grown faster than AWS revenue, suggesting that margins are improving. Not long ago, one of the biggest red flags for Amazon’s investment thesis was that AWS couldn’t keep up its margins in the face of mounting competition. But the results tell a different story and are likely a reason why the stock has been crushing the market as of late.
A higher-quality business
Amazon is notorious for reinvesting profits back into the company. So using net income-based metrics like the price-to-earnings ratio can be unhelpful. Traditionally, Amazon’s go-to metric was its price-to-sales ratio, which is the value of a company compared to its revenue. In the following chart, you’ll notice that Amazon’s P/S ratio is higher than historical levels — suggesting the stock is more expensive.
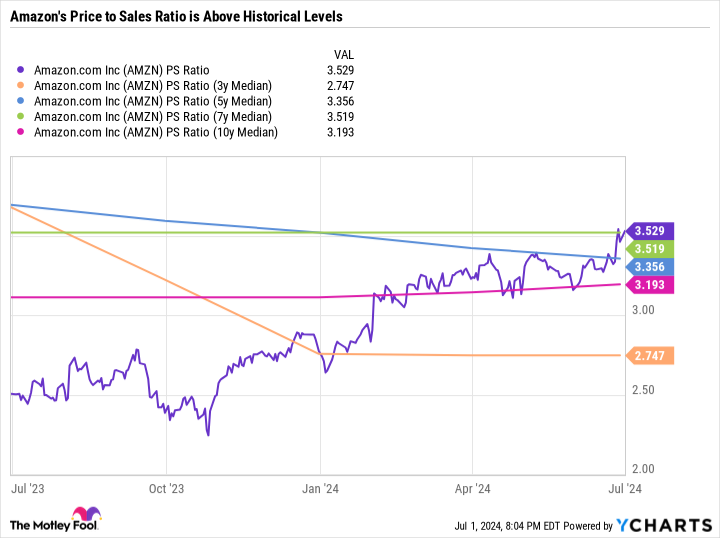
The P/S ratio can be useful when dealing with a consistent business over a period of time. But the issue with using it to evaluate Amazon is that the company is fundamentally different today than it was even two to three years ago because of the growth of AWS. That’s why I think the best way to value Amazon is by looking at its P/S ratio within the context of its operating income and operating margin.
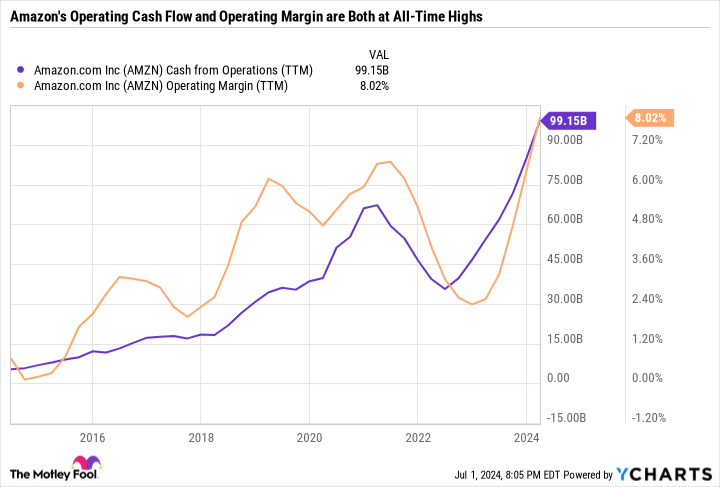
This chart is perhaps the simplest way to visualize Amazon’s success. Amazon’s TTM operating income is nearly $100 billion, and its operating margin is at a 10-year high thanks to AWS and a rebound in its North America and international segments.
Paying a 3.53 P/S ratio for a high-growth, low-margin business is one thing. But that same ratio for a company growing its top line and expanding margins is entirely different.
The biggest bull case for Amazon is that it is within striking distance of its historical P/S ratio, but the quality of the business is vastly improved, and it is on a path toward consistent profitability. After all, analyst consensus estimates call for $4.55 in 2024 earnings per share (EPS) and $5.78 in 2025 EPS — giving Amazon a 34.1 P/E based on 2025 estimated earnings. That’s not a sky-high valuation — especially when considering the stock is up 130% in 18 months.
Amazon is stretched thin but is still a good buy
Amazon is at the top of its game, but its stock chart reflects that. Warren Buffett once said, “You pay a very high price in the stock market for a cheery consensus.” In other words, consensus positivity toward a company usually results in an expensive stock price, just as an out-of-favor stock can be quite cheap.
Less than two years ago, Amazon was under immense pressure due to slowing growth and recession fears. It was the opposite of a cheery consensus. Today, Amazon is, once again, a darling. But the long-term investment thesis has also gotten stronger as AWS continues to be a high-margin growth engine that can fuel the company’s other exploits.
All told, Amazon is a decent buy, but it is no longer the no-brainer buy it was before. It still must grow into its valuation and prove its higher margins aren’t a one-off. If growth slows, expect Amazon to be under pressure.
The higher a stock runs up in the short term, the more its valuation gets stretched. But over the long term, Amazon certainly has the trajectory needed to compound earnings and benefit patient investors.
Should you invest $1,000 in Amazon right now?
Before you buy stock in Amazon, consider this:
The Motley Fool Stock Advisor analyst team just identified what they believe are the 10 best stocks for investors to buy now… and Amazon wasn’t one of them. The 10 stocks that made the cut could produce monster returns in the coming years.
Consider when Nvidia made this list on April 15, 2005… if you invested $1,000 at the time of our recommendation, you’d have $786,046!*
Stock Advisor provides investors with an easy-to-follow blueprint for success, including guidance on building a portfolio, regular updates from analysts, and two new stock picks each month. The Stock Advisor service has more than quadrupled the return of S&P 500 since 2002*.
*Stock Advisor returns as of July 2, 2024
Randi Zuckerberg, a former director of market development and spokeswoman for Facebook and sister to Meta Platforms CEO Mark Zuckerberg, is a member of The Motley Fool’s board of directors. Suzanne Frey, an executive at Alphabet, is a member of The Motley Fool’s board of directors. John Mackey, former CEO of Whole Foods Market, an Amazon subsidiary, is a member of The Motley Fool’s board of directors. American Express is an advertising partner of The Ascent, a Motley Fool company. Daniel Foelber has no position in any of the stocks mentioned. The Motley Fool has positions in and recommends Alphabet, Amazon, Meta Platforms, Microsoft, and Walmart. The Motley Fool recommends the following options: long January 2026 $395 calls on Microsoft and short January 2026 $405 calls on Microsoft. The Motley Fool has a disclosure policy.
Amazon Is Now the Best-Performing Stock in the Dow Jones Industrial Average In 2024. Is It a Buy Around Its All-Time High? was originally published by The Motley Fool
Signup bonus from