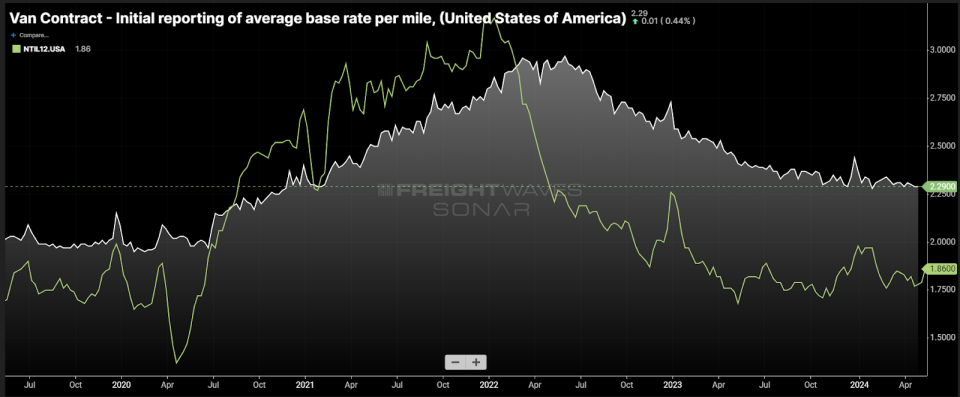
Chart of the Week: Van Contract Initial reporting of average base rate per mile, National Truckload Index removing estimated fuel costs above $1.20/mile – USA SONAR: VCRPM1.USA, NTIL12.USA
Truckload contract rates (VCRPM1) continue to show strong elevation in relation to spot rates excluding estimated fuel costs above $1.20 a gallon (NTIL12). This historic spread — currently about 30% versus about 12% in 2019 — suggests there is an extraordinary amount of potential disparity among rates in the truckload market that could leave several shippers without a truck when the market inevitably shifts.
Contract or long-term rates are generally negotiated on an annual basis between shipper and transportation service provider.
In an erratic capacity environment, these rates are subject to midterm renegotiation, both higher and lower. This is where the term “paper rates” originates, because they are as thin as paper in terms of reliability.
On the spot
Spot rates are negotiated on an ad hoc or transactional basis and are typically only good for a matter of days.
The spot market is a place where shippers look to source capacity when they either do not have a contract carrier or their existing carriers do not have availability. In loose capacity environments — such as the current one — it can also be a place to get immediate cost savings or try other carriers to deepen their lists of potential providers.
From the carrier perspective, the spot market is a place to fill gaps in their networks — aka backhauls — or haul more profitable freight. The former is more the use case in a market like the one that we are currently in, though there is always this potential.
Too many trucks for too long
The current market is historically oversupplied, with capacity having been inflated to an unsustainable level by the pandemic-era consumption boom. The U.S. truckload market has been in a recession since the first half of 2022 but is moving toward a more balanced environment nearly invisibly.
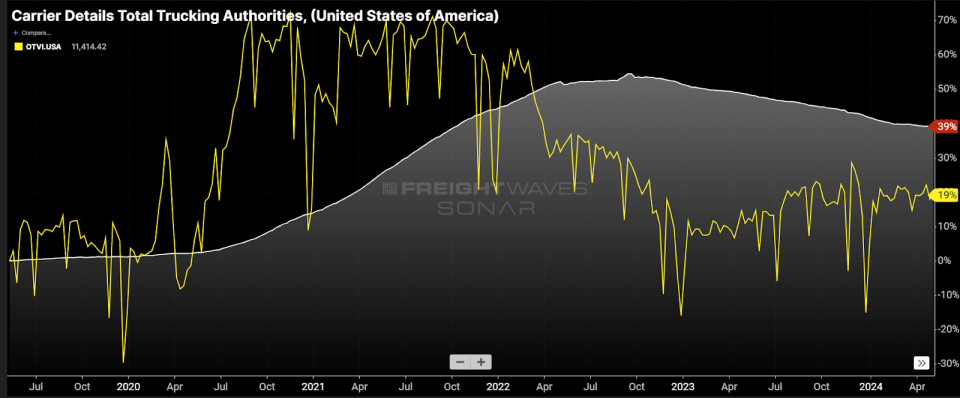
Looking at an example of supply and demand dynamics in the form of active motor carrier of property operating authorities issued by the Federal Motor Carrier Safety Administration versus the national Outbound Tender Volume Index (OTVI), capacity is falling while demand is stable.
While this is not a perfect comparison since an operating authority can be one or 5,000 trucks, it is a good indication that capacity is coming offline and the market is moving toward equilibrium.
The current ratio of operating authority to tender is about 31:1. Historically, the market has been tight when the ratio is below 24:1. The ratio peaked in early 2023 around 37:1 and was at its lowest in September 2020 around 16:1. This is by no means scientific but just a way to estimate where we are in the process.
Chasing the bottom
During this lengthy downturn, rates have been pushed to levels where carriers are at or below costs as they bid against each other to maintain enough volume to support their fleets. The spot market is the most extreme version of this as it is used as a last resort for many asset-based providers.
Traditionally there are shippers, carriers and brokers who offer rates based on the spot market rates which are largely below carrier operating costs. Shippers and brokers who have long-term rates at or near spot market prices are at the most risk for increased levels of service failure later in the year when the market is expected to tighten.
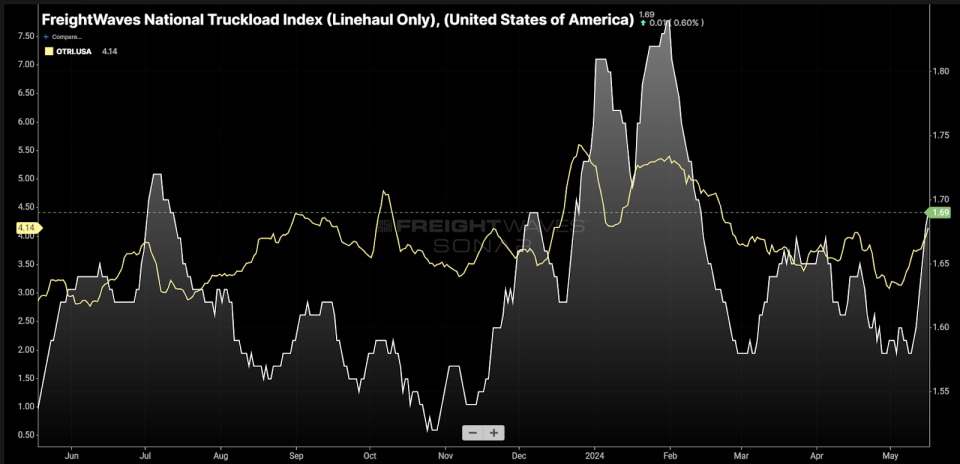
It is hard to tell, but spot rates are already trending higher over the past year as capacity has fallen out. This is telling, as it is an indication that the spot market is effectively the floor for pricing and it is rising at a near-imperceptible rate.
Roadcheck
International Roadcheck took place this past week, with safety officials conducting inspection blitzes on equipment. Many operators, especially in a market where rates are suppressed, avoid driving during this week, which causes a temporary reduction in capacity. Spot rates have spiked 7% over the past week.
Shippers saw their service failure chances increase during this time. Tender rejection rates increased from 3.1% to 4.1% last week. There have been stronger jumps but shippers who have rates on the low end of the spectrum had the biggest exposure to this event.
Both spot and rejection rates remained relatively low from a historic standpoint — the market still has plenty of available capacity to recover from such an event — but that buffer is deteriorating.
Just a drop in the ocean, but a wave is approaching
More than the summer shipping season, the fourth quarter will likely be a much tighter environment with much less predictable demand. Shippers’ sense of urgency is also much higher as retail peak hits.
It will not take much to cause a waterfall of service failures if carriers get the chance to haul profitable freight. The most desperate carriers will have given the lowest rates and will likely be the first to jump ship to make ends meet at the slightest sign of disruption.
The result of that could be crippling to companies that chased the bottom dollar or based long-term rate targets on the spot market.
About the Chart of the Week
The FreightWaves Chart of the Week is a chart selection from SONAR that provides an interesting data point to describe the state of the freight markets. A chart is chosen from thousands of potential charts on SONAR to help participants visualize the freight market in real time. Each week a Market Expert will post a chart, along with commentary, live on the front page. After that, the Chart of the Week will be archived on FreightWaves.com for future reference.
SONAR aggregates data from hundreds of sources, presenting the data in charts and maps and providing commentary on what freight market experts want to know about the industry in real time.
The FreightWaves data science and product teams are releasing new datasets each week and enhancing the client experience.
To request a SONAR demo, click here.
The post Historic trucking rate disparity could cripple service in late ’24 appeared first on FreightWaves.
Signup bonus from