On the surface, U.S. stock indexes like the S&P 500 lately seem to move in only one direction: up. The same cannot be said for their individual member stocks.
Most Read from MarketWatch
A team of strategists at Charles Schwab & Co. highlighted this dichotomy between the relatively calm performance of the major equity indexes, and the more chaotic moves seen by their constituents, in a report published earlier this week.
Their findings offer insight into what makes this bull market unique compared with bull runs of the past — and why some remain skeptical of the market’s ascent.
They found that while the S&P 500 has barely budged from its record highs in 2024, the average stock included in the index has been far more volatile.
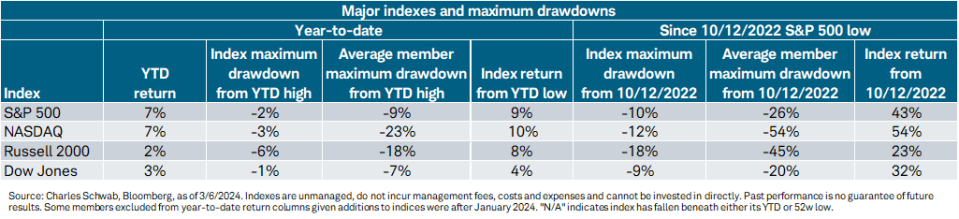
Since the beginning of the year, the S&P 500 SPX has experienced a maximum drawdown of 2% through Wednesday, compared with 9% for the average index constituent. Such broad dispersion between volatility at the index level and volatility of individual stocks is pretty unusual, said Kevin Gordon, senior investment strategist at Schwab, who authored the report along with his colleague, Liz Ann Sonders.
“This behavior is not typical of a bull market,” Gordon said during a phone interview with MarketWatch. “But at the same time, this is not a typical cycle.”
In fact, a bull might not be the best animal to capture the essence of the current market, according to Sonders.
“The reality is the stock market is acting a little more like a duck than a bull: calm on the surface but paddling like the dickens underneath,” she said in the report.
This discrepancy is even greater for the Nasdaq Composite COMP: the tech-heavy index has seen a maximum drawdown of just 3% this year, while the average Nasdaq stock has fallen 23% from peak to trough.
This applies also if one measures performance since Oct. 12, 2022, the day the bull market began. Since then, the S&P 500 has risen 43% through Wednesday’s close with a maximum drawdown of 10%. Meanwhile, the average index stock has seen a pullback of 26%, as the chart below shows.
Similar patterns can be observed for the small-cap Russell 2000 RUT and the Dow Jones Industrial Average DJIA.
The difference between volatility at the index level and volatility for individual stocks is indicative of what has become a lopsided market, Gordon said, where a handful of stocks mask the relatively weak performance of many of the index’s constituents.
Roughly half of the issues in the S&P 500 are trading below their levels from January 2022, while roughly 10% of the individual stocks in the index have outperformed it over the past year — an historically low percentage at this point in a bull market.
“Typically, more than a year into a bull market, you see a much higher percentage of companies that have taken out their prior highs,” Gordon said.
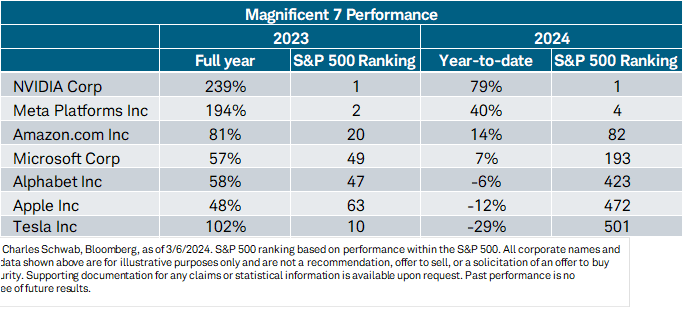
Fortunately for investors who favor index-tracking funds, the dramatic outperformance of a handful of the largest U.S.-traded stocks has more than compensated for weakness elsewhere. A group of seven megacap stocks known as the Magnificent Seven drove the bulk of the S&P 500’s 24% advance in 2023, according to FactSet data.
Although several members of this group have lagged since the beginning of 2024, explosive gains by Nvidia Corp. NVDA and Meta Platforms Inc. META have helped to compensate, as the Schwab team illustrated in the chart below.
The Magnificent Seven comprises Nvidia, Microsoft Corp. MSFT, Apple Inc. AAPL, Amazon.com Inc. AMZN, Meta, Alphabet Inc. GOOGL and Tesla Inc. TSLA
While market breadth — that is, the number of individual shares participating in the rally — has improved recently, it hasn’t happened in a straight line. The chart below shows that the share of stocks trading above their long-term average has risen since the start of the year, but remains below its cycle highs from December.

Gordon views this as a suitable proxy for participation. The share of stocks trading above their 200-day moving average has also proved to be a reliable leading indicator of trouble ahead in the past.
For example, participation started to decline in late 2021, a few months before the S&P 500 peaked in early January 2022. A similar dynamic played out before COVID-19 upended markets in March 2020.
Right now, breadth appears to be slowly improving. If this continues, the volatility gap between the indexes and their members should shrink. Gordon and Sonders see this as essential for the rally to continue.
Investors received some welcome news on this front Thursday when the equal-weight version of the S&P 500 XX:SP500EW finally took out its previous record high from Jan. 4 2022, according to Dow Jones Market Data.
That the equal-weight index has outperformed its market-cap-weighted sibling since the beginning of March is another encouraging sign of improving breadth, as is the fact that it has nearly kept pace with its cap-weighted sibling since the latest leg of the bull market began in late October.
One of the most pressing questions for stock investors now is whether this trend can continue, they said.
Most Read from MarketWatch
Signup bonus from