Schools adjust schedules for Tuesday ahead of severe weather
Schools across North Carolina and South Carolina are adjusting their plans ahead of severe weather that’s expected to roll in on Tuesday.
The Severe Weather Center 9 team is tracking a strong line of storms that could bring high winds, heavy rain, and the threat of tornadoes. It’s expected to start Tuesday morning and last through most of the day. Keep updated with weather threats at this link.
In response to the wind and tornado threats, school districts in the Charlotte area have announced cancellations or plans to use remote learning instead.
Think you’ve got the worst drivers in the country? A new study by LendingTree ranked the states’ drivers from best to worst based on number of driving incidents. Driving incidents are defined as accidents, DUIs, speeding-related incidents, and citations. (Photos provided by Canva, Getty, Department of Transportation)
Michigan: 11.28 driving incidents per 1,000 residents
Arkansas: 12.81 driving incidents per 1,000 residents
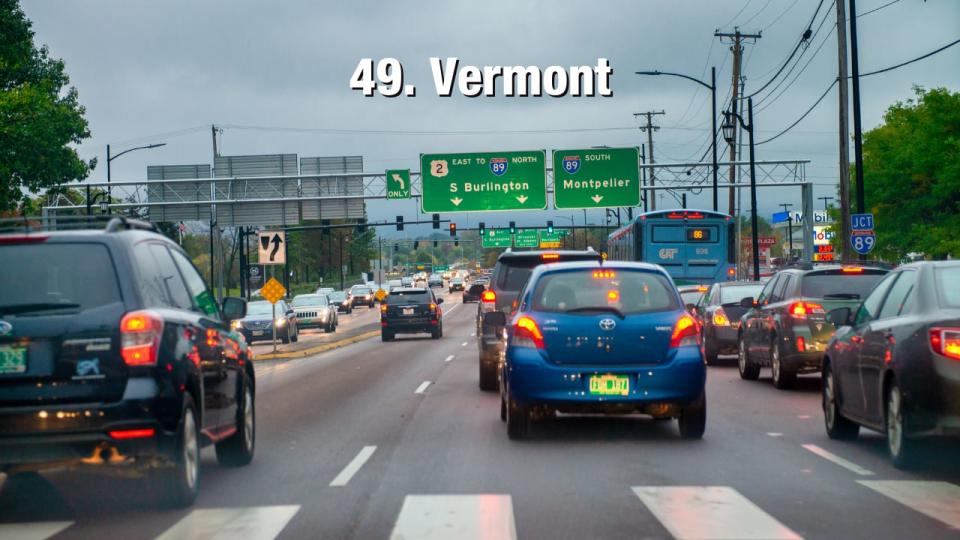
Vermont: 14.87 driving incidents per 1,000 residents
Kentucky: 15.14 driving incidents per 1,000 residents
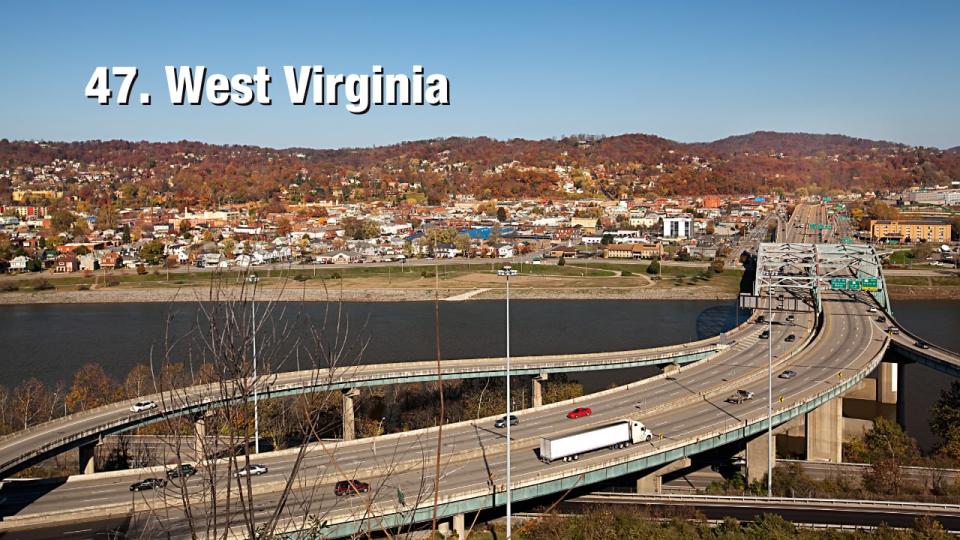
West Virginia: 15.33 driving incidents per 1,000 residents
Oklahoma: 15.75 driving incidents per 1,000 residents
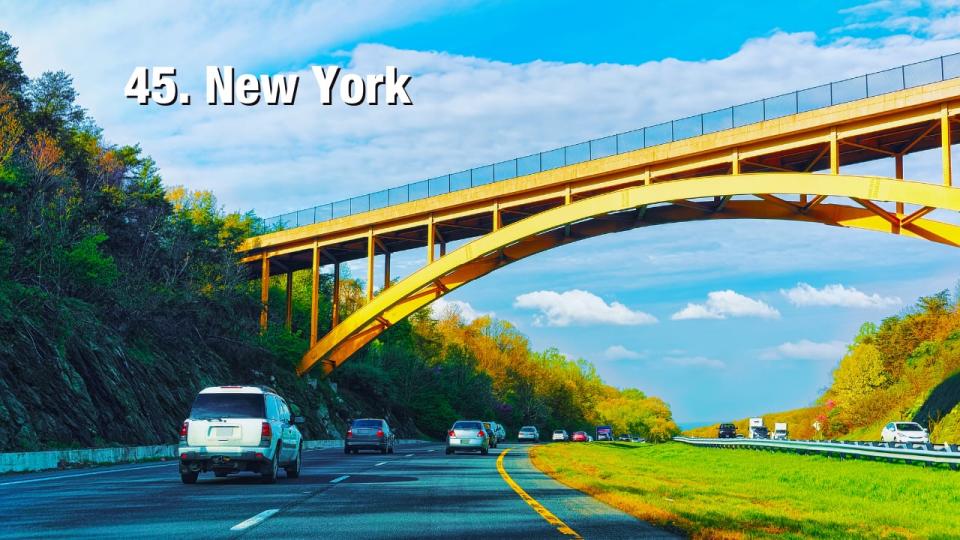
New York: 16.56 driving incidents per 1,000 residents
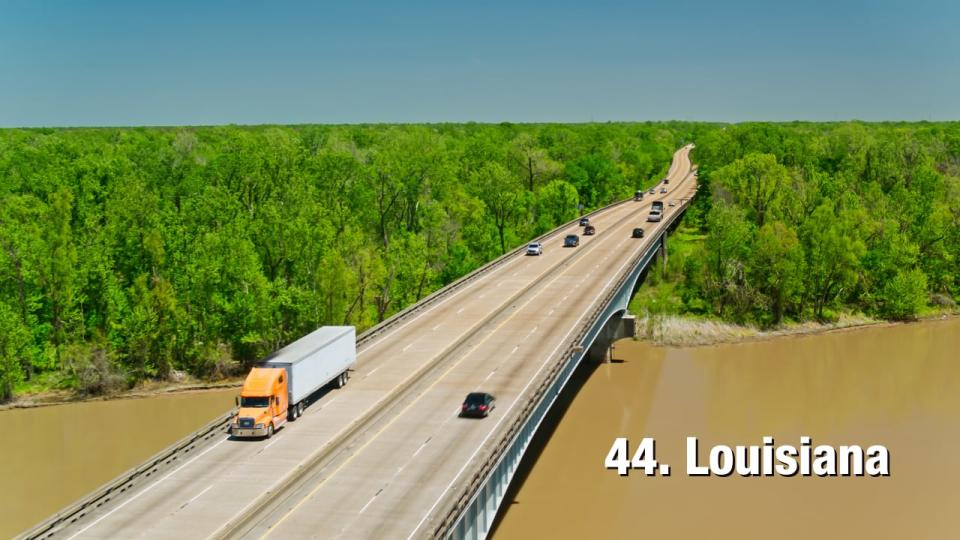
Louisiana: driving incidents per 1,000 residents
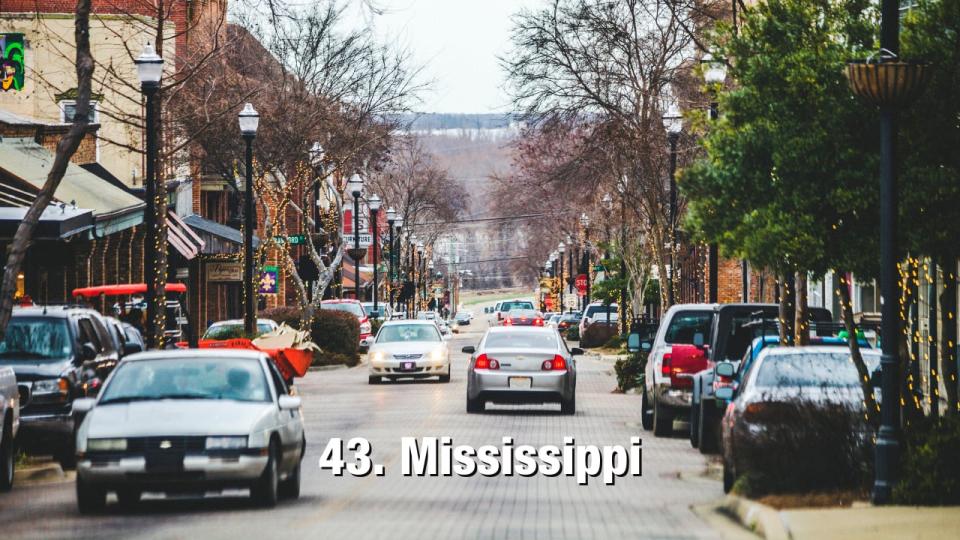
Mississippi: 17.10 driving incidents per 1,000 residents
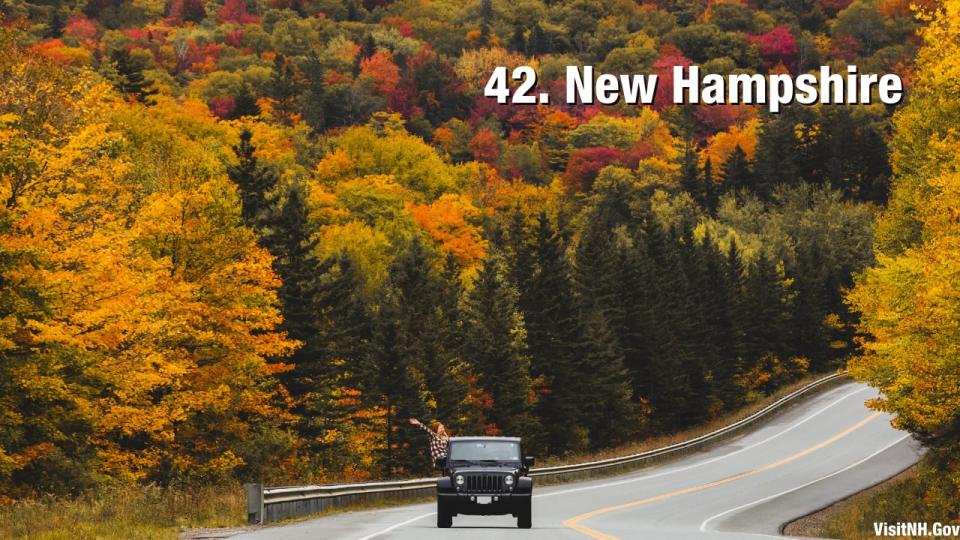
New Hampshire: 17.35 driving incidents per 1,000 residents
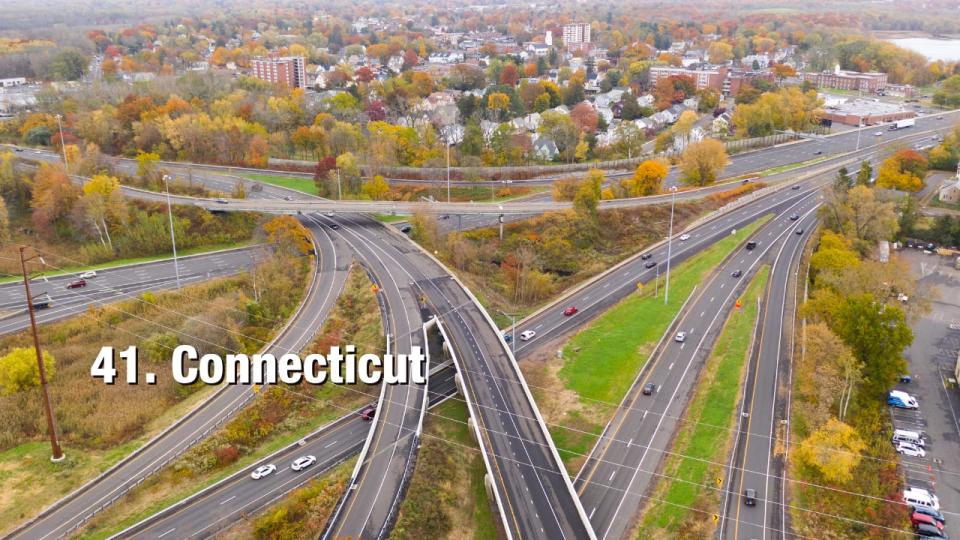
Connecticut: 18.02 driving incidents per 1,000 residents
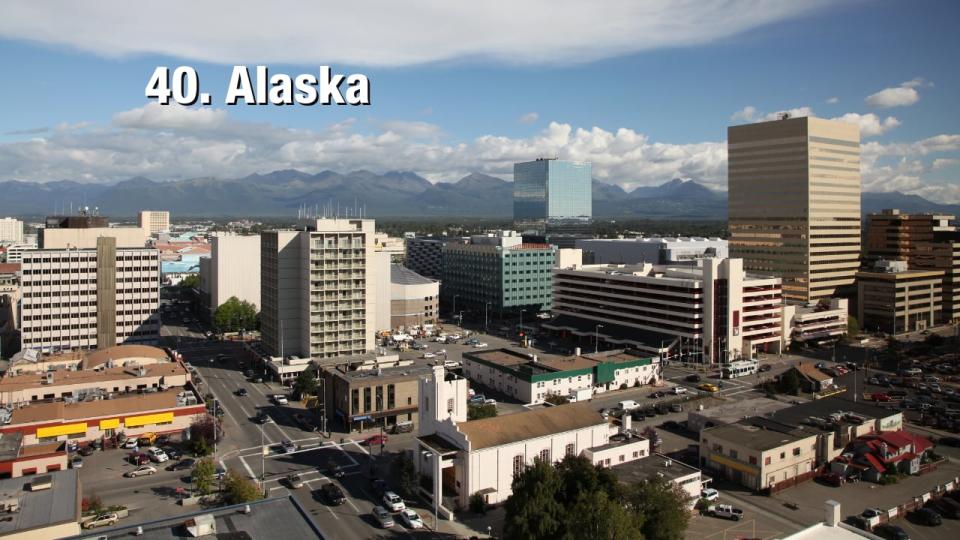
Alaska: 18.32 driving incidents per 1,000 residents
Nevada: 18.89 driving incidents per 1,000 residents
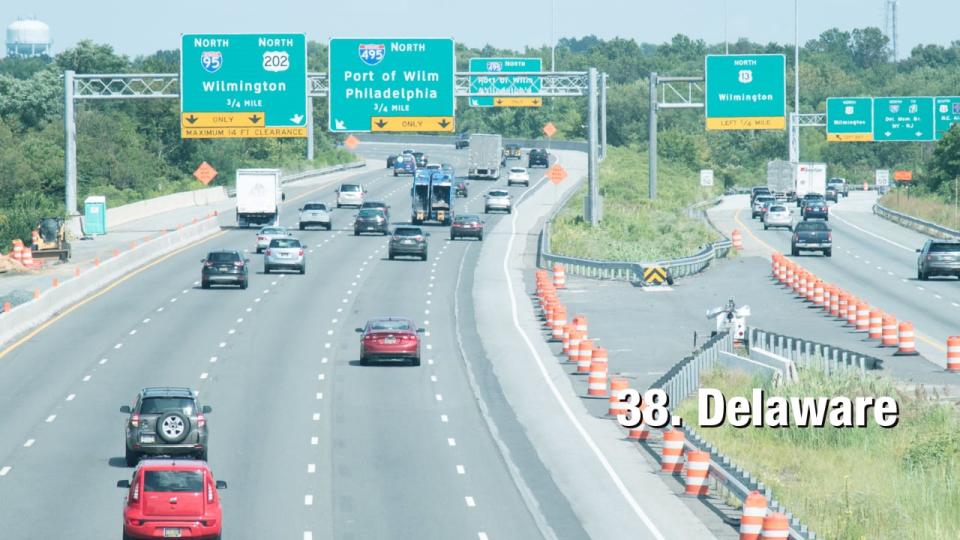
Delaware: 18.90 driving incidents per 1,000 residents
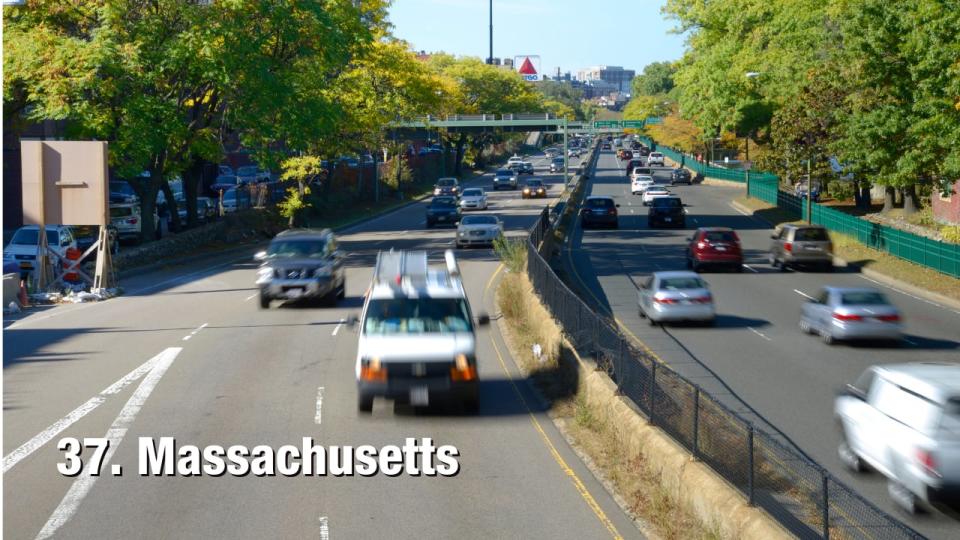
Massachusetts: 19.29 driving incidents per 1,000 residents
South Dakota: 19.38 driving incidents per 1,000 residents
Pennsylvania: 19.70 driving incidents per 1,000 residents
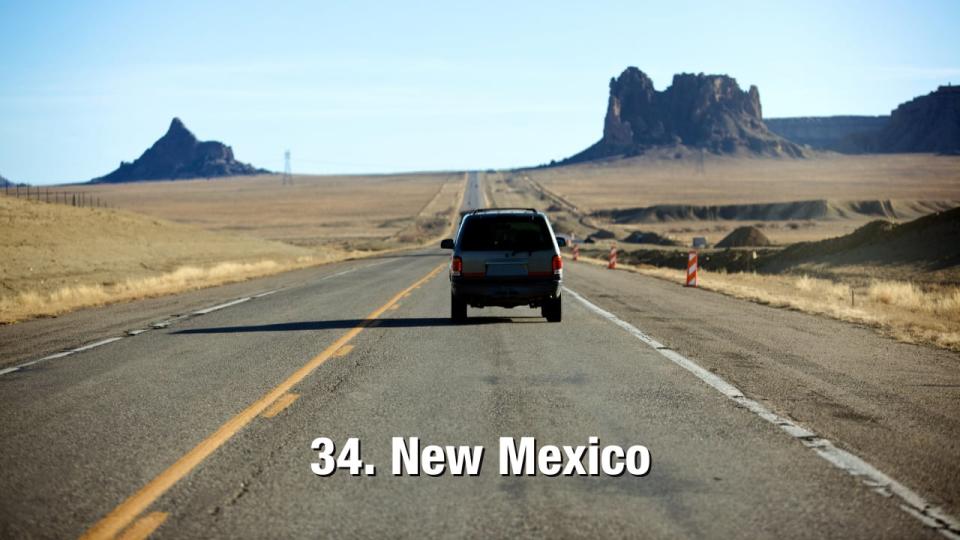
New Mexico: 19.89 driving incidents per 1,000 residents
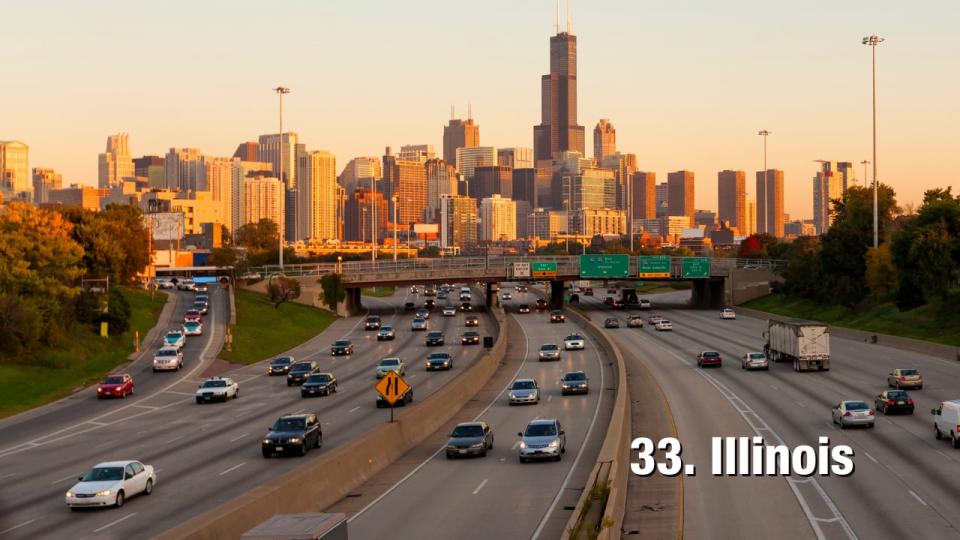
Illinois: 21.41 driving incidents per 1,000 residents
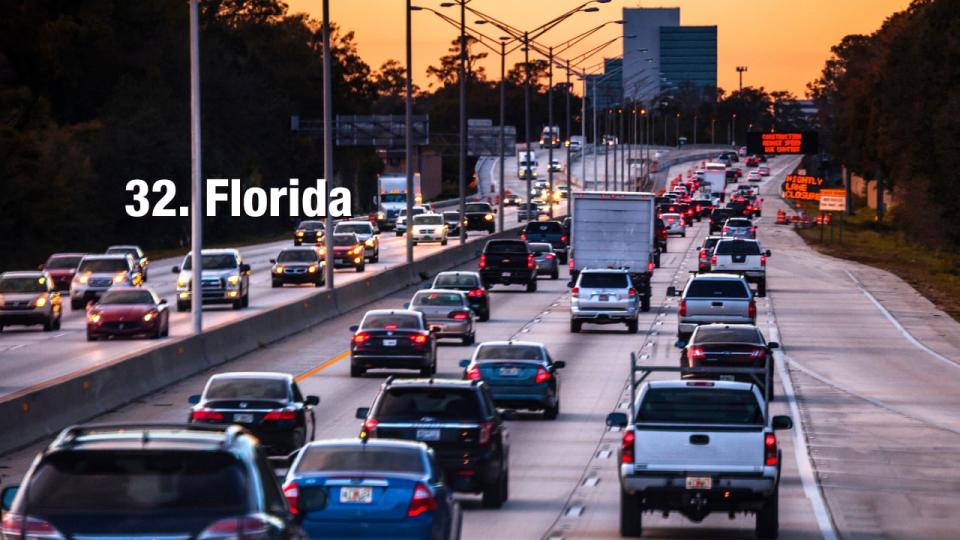
Florida: 21.96 driving incidents per 1,000 residents
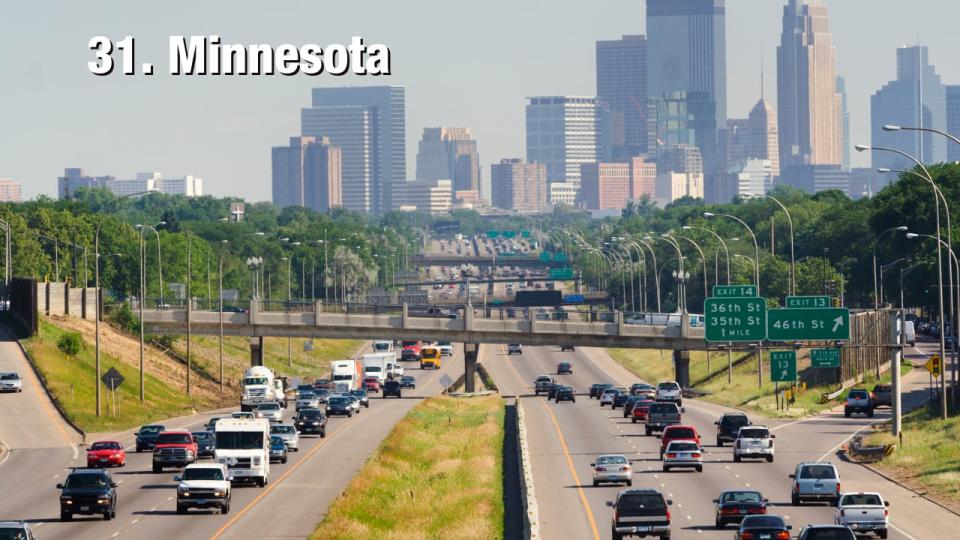
Minnesota: 22.63 driving incidents per 1,000 residents
Colorado: 22.88 driving incidents per 1,000 residents
Kansas: 23.01 driving incidents per 1,000 residents
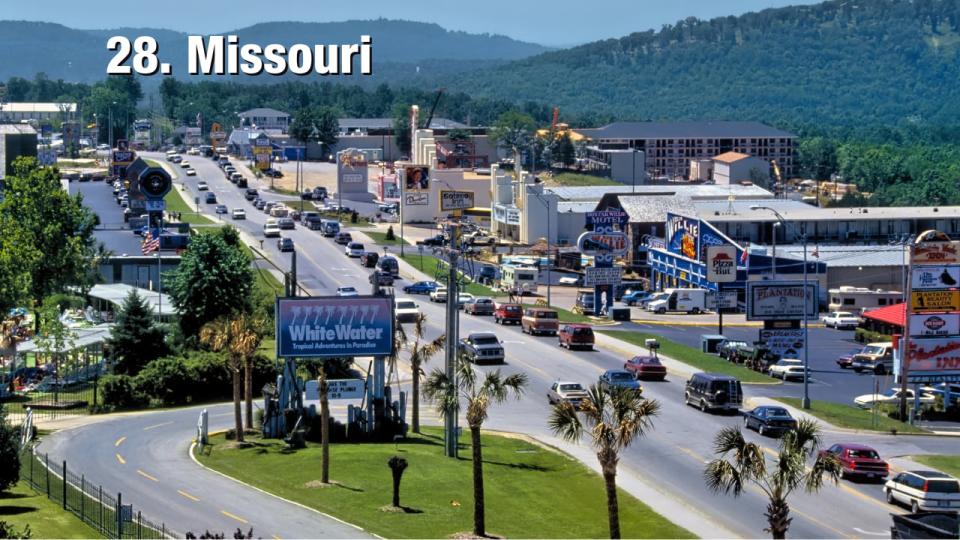
Missouri: 23.12 driving incidents per 1,000 residents
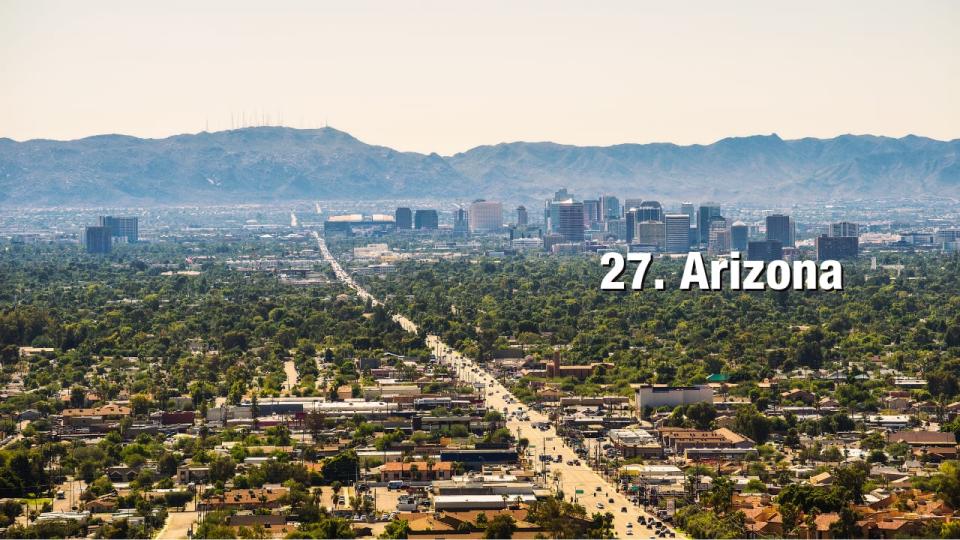
Arizona: 23.38 driving incidents per 1,000 residents
Alabama: 23.52 driving incidents per 1,000 residents
Wyoming: 23.62 driving incidents per 1,000 residents
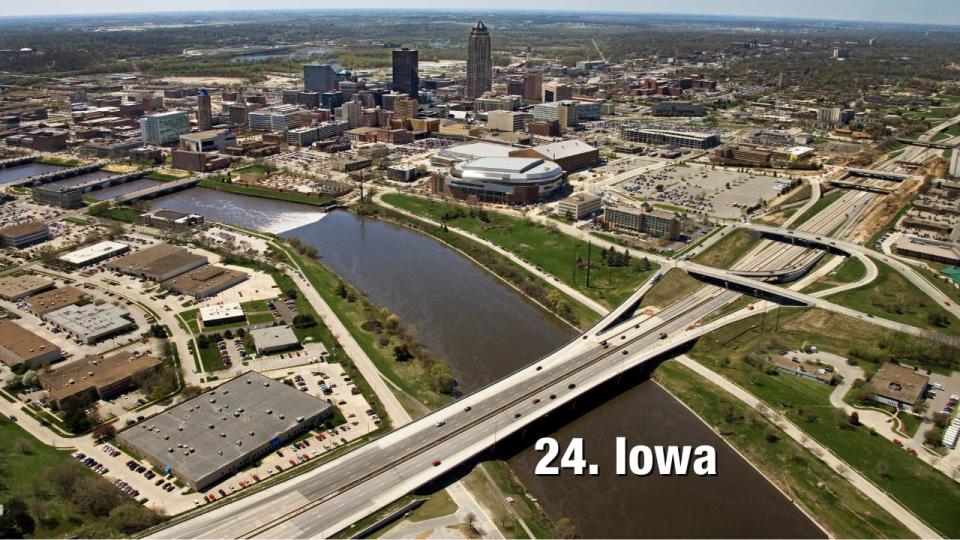
Iowa: 24.42 driving incidents per 1,000 residents
New Jersey: 24.71 driving incidents per 1,000 residents
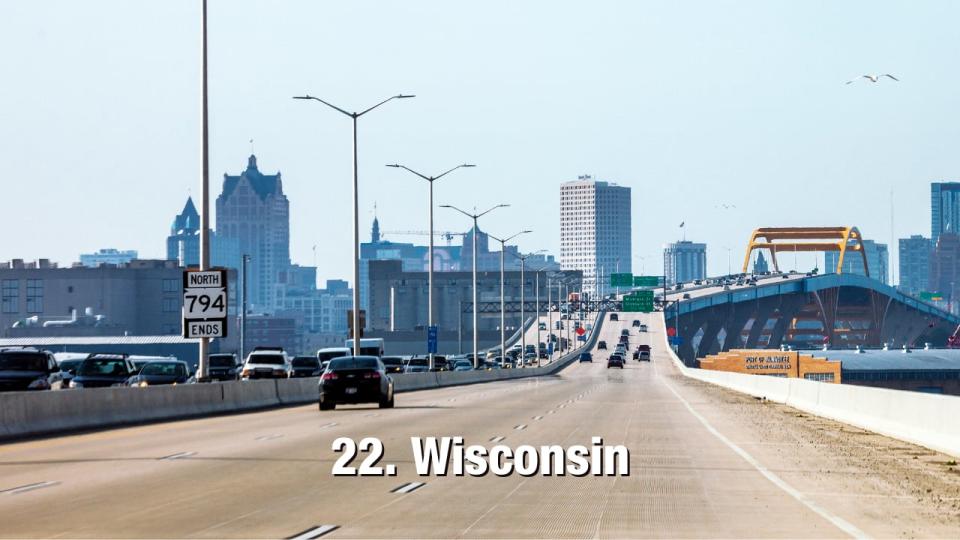
Wisconsin: 24.85 driving incidents per 1,000 residents
Tennessee: 25.12 driving incidents per 1,000 residents
Georgia: 25.35 driving incidents per 1,000 residents
Texas: 25.61 driving incidents per 1,000 residents
Nebraska: 25.80 driving incidents per 1,000 residents
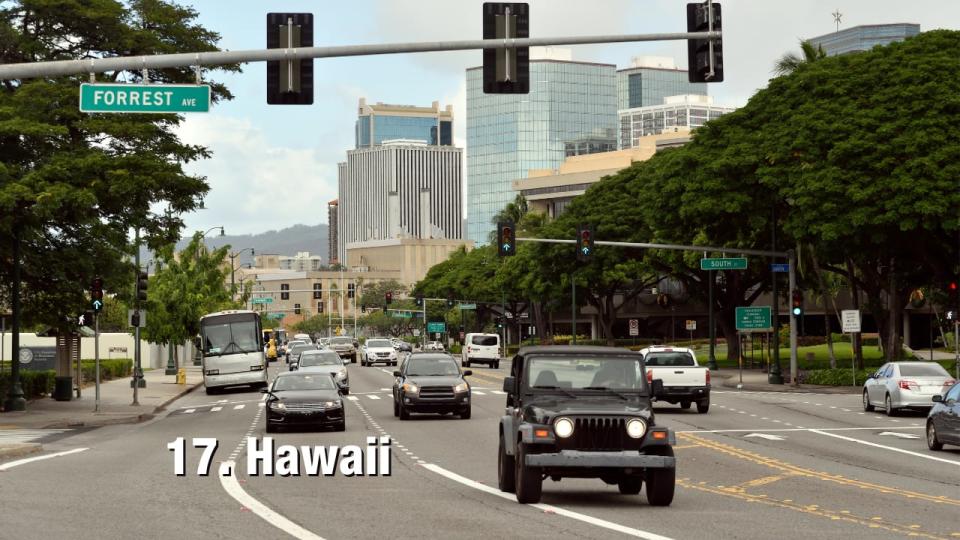
Hawaii: 26.02 driving incidents per 1,000 residents
Idaho: 26.48 driving incidents per 1,000 residents
Maryland 27.07 driving incidents per 1,000 residents
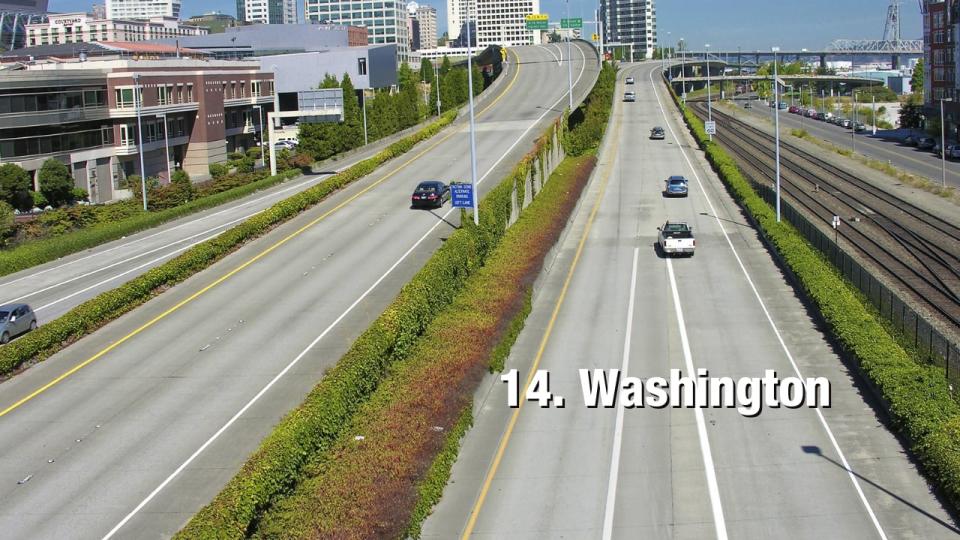
Washington: 27.34 driving incidents per 1,000 residents
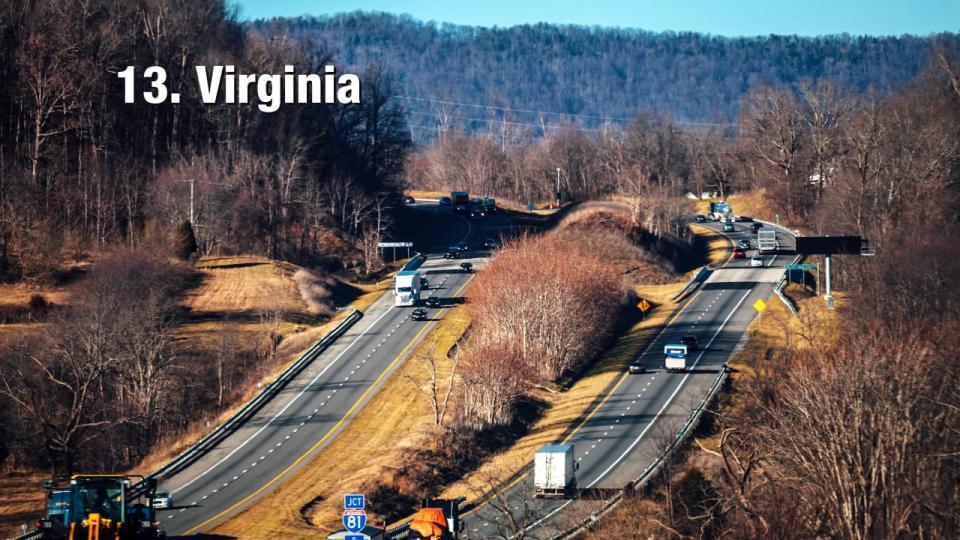
Virginia: 27.65 driving incidents per 1,000 residents
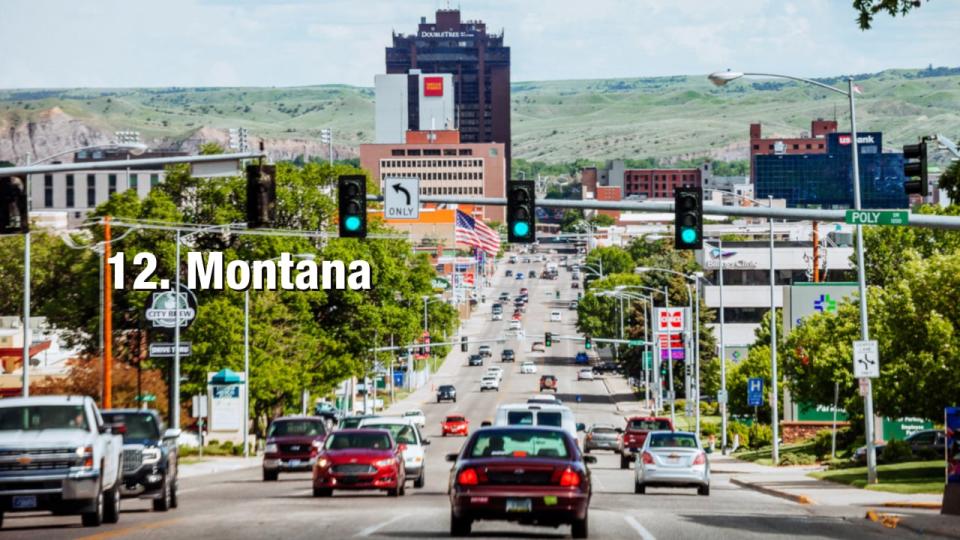
Montana: 28.02 driving incidents per 1,000 residents
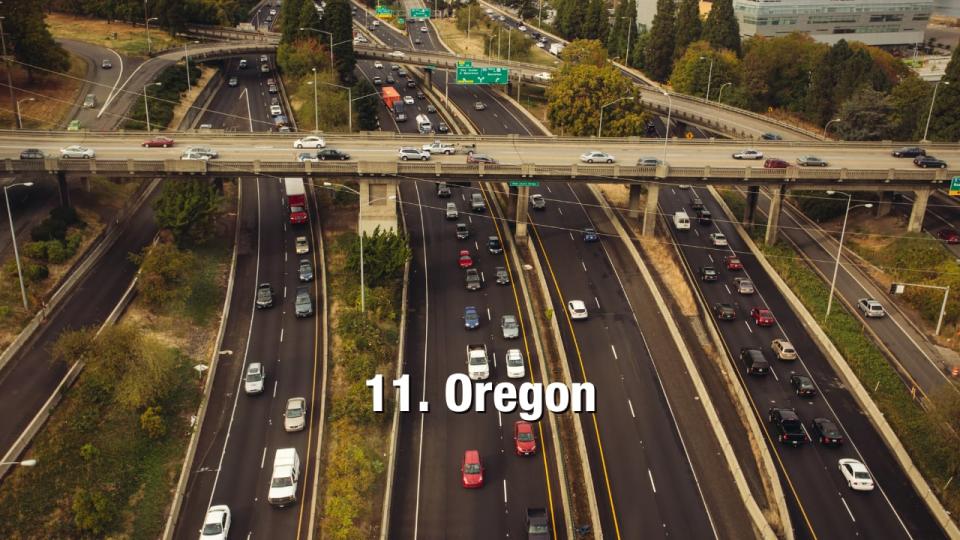
Oregon: 28.41 driving incidents per 1,000 residents
North Dakota: 28.56 driving incidents per 1,000 residents
Ohio: 28.90 driving incidents per 1,000 residents
South Carolina: 29.12 driving incidents per 1,000 residents
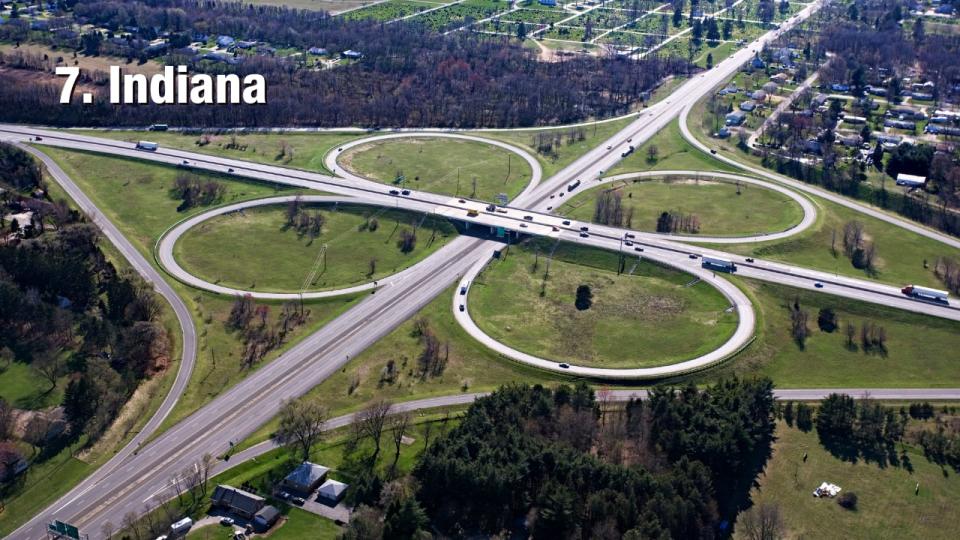
Indiana: 29.81 driving incidents per 1,000 residents
Utah: 31.07 driving incidents per 1,000 residents
North Carolina: 32.44 driving incidents per 1,000 residents
Washington D.C.: 35.16 driving incidents per 1,000 residents
California: 40.37 driving incidents per 1,000 residents
Maine: 50.05 driving incidents per 1,000 residents
Rhode Island: 51.33 driving incidents per 1,000 residents